/ GUIDES & INSPIRATION
Why the KP Index Won't Tell You If You'll See the Northern Lights

Open any aurora app and the first thing you’ll see is a number between 0 and 9. KP 3. KP 5. Maybe a little bar chart of the next three days. Book the tour with the highest number, the logic goes, and you’ve given yourself the best chance.
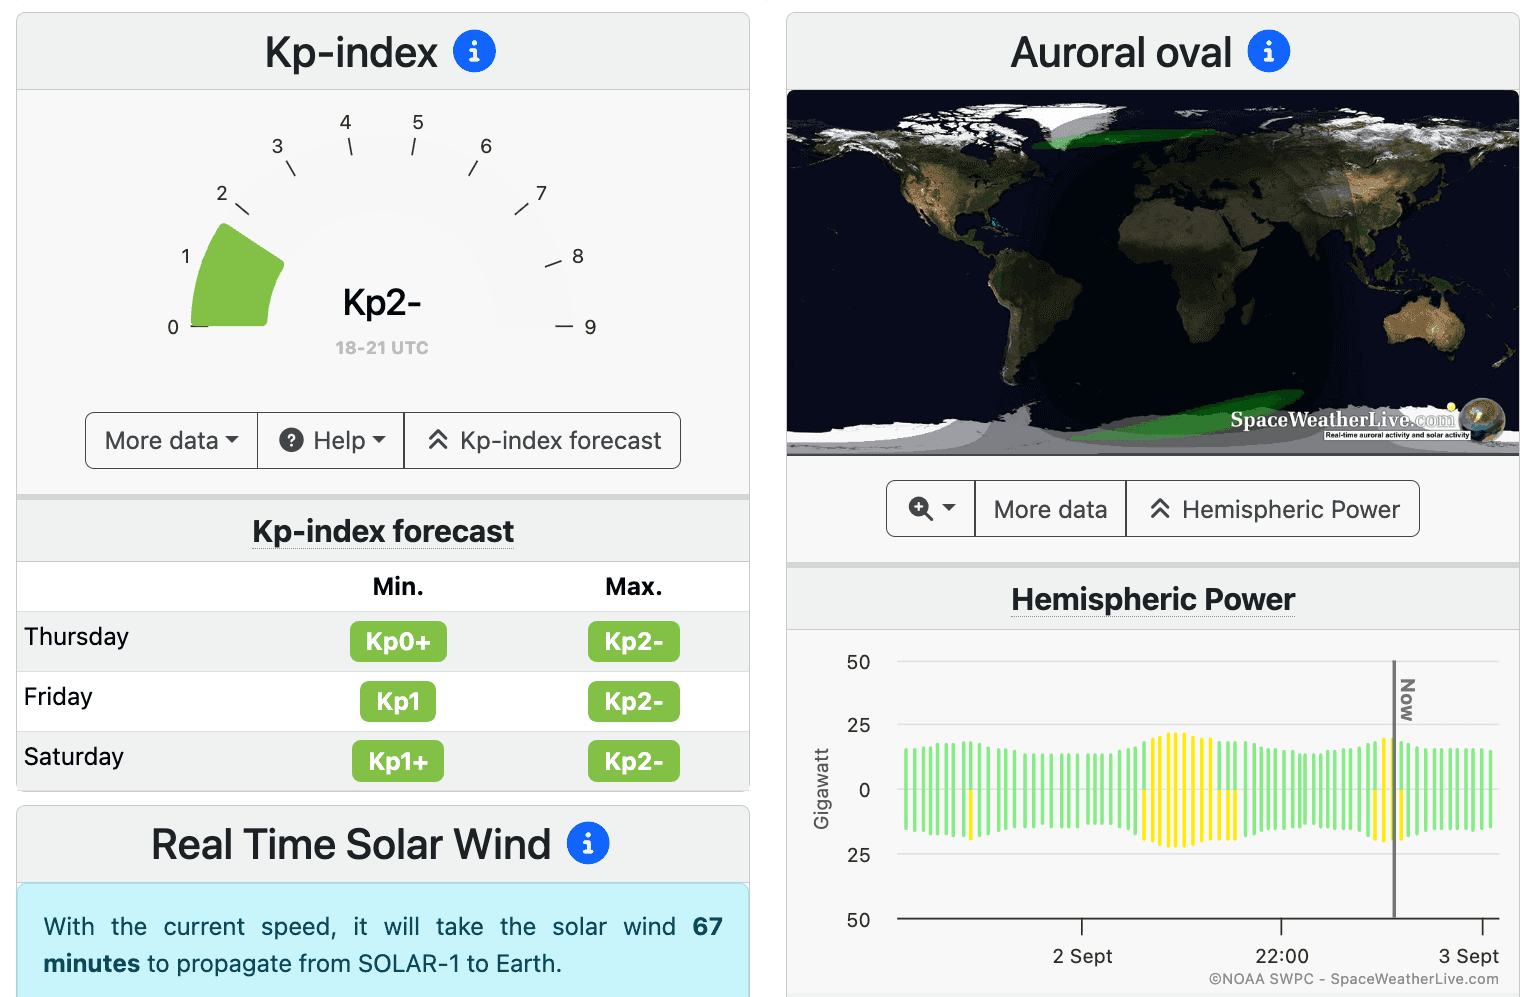
It doesn’t work like that. We’ve had spectacular nights at KP 2 and seen nothing at all at KP 6. If you plan a trip around that number alone, you’ll book the wrong nights and miss the right ones.
Here’s what actually decides it.
The Number That Matters Is Bz
The aurora happens when charged particles from the sun reach Earth’s magnetic field and get funnelled down into the atmosphere near the poles. But Earth’s magnetic field is also a shield. Most of the time it deflects that solar wind straight past us.
What lets the particles through is the direction of the magnetic field carried by the solar wind itself. That direction is measured as Bz, and it’s given as a positive or negative number in nanoteslas.
When Bz is positive — pointing north — it aligns with Earth’s own field and the shield holds. The particles get pushed around us. You can have a fast solar wind, a big coronal hole, a headline-grabbing forecast, and still see nothing.
When Bz flips negative — pointing south — the two fields connect. The shield opens. Particles pour in along the field lines and the sky lights up.
That’s the switch. A Bz of -5 will usually give you something. A Bz of -10 or lower, sustained for a while, is when the sky puts on the kind of display people travel across the world for.
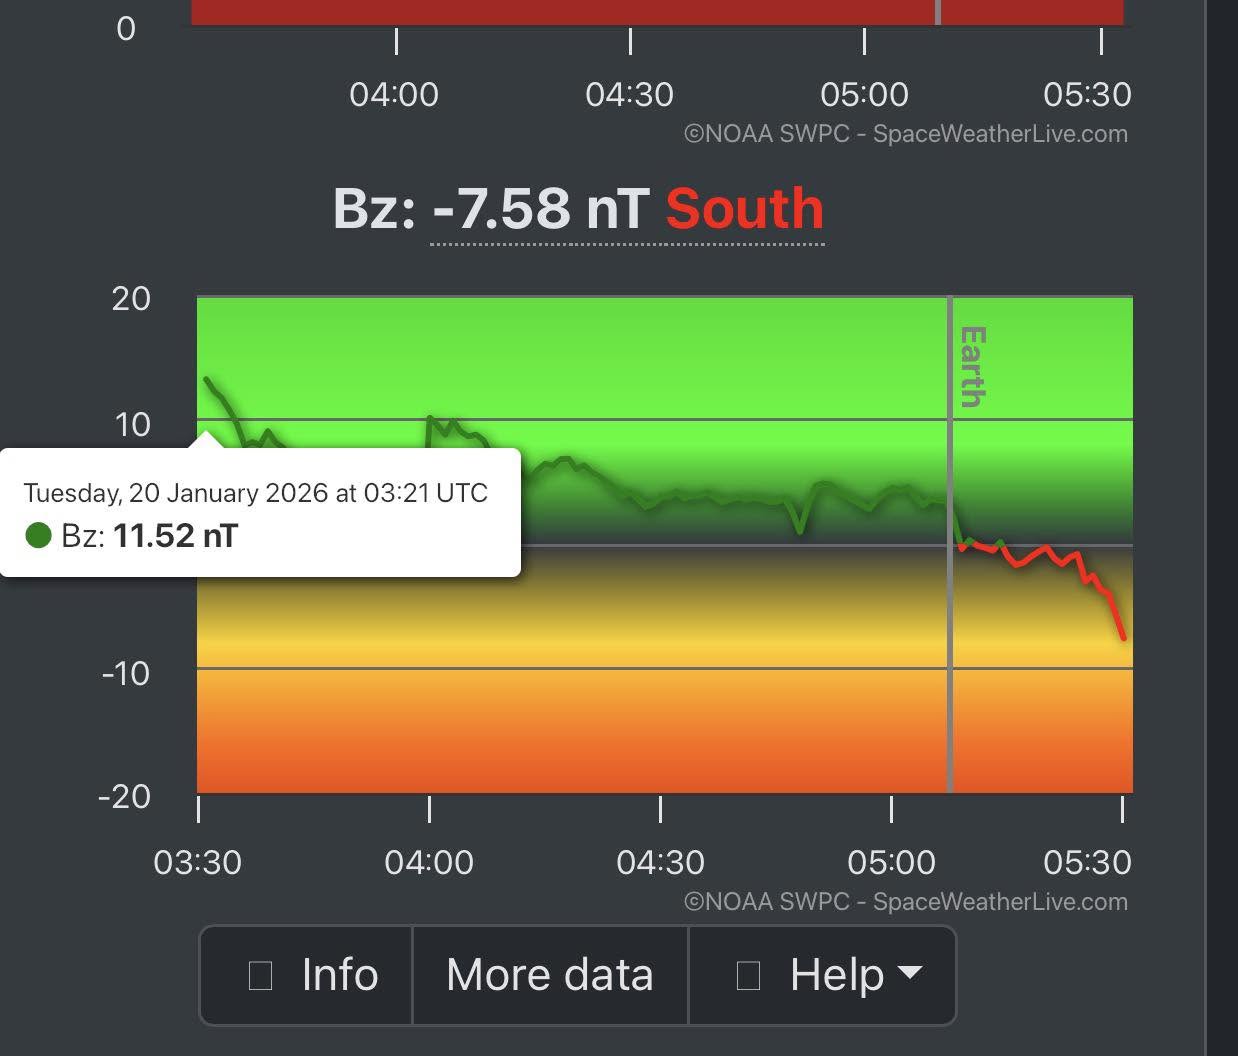
KP, by contrast, is a planetary average of geomagnetic disturbance, compiled in three-hour blocks and published after the fact. It tells you how active the last three hours were, averaged across the whole planet. It’s a useful historical record. It is not a forecast, and it says nothing about the next hour above your head.
Where the Data Comes From
The reason any of this is knowable in advance is a satellite called DSCOVR, parked about 1.5 million kilometres from Earth at a point called L1 — a gravitational balance point directly between us and the sun.
Everything in the solar wind passes DSCOVR before it reaches us. The satellite measures the speed, the density and, critically, the magnetic field direction — the Bz — and sends that data back continuously.
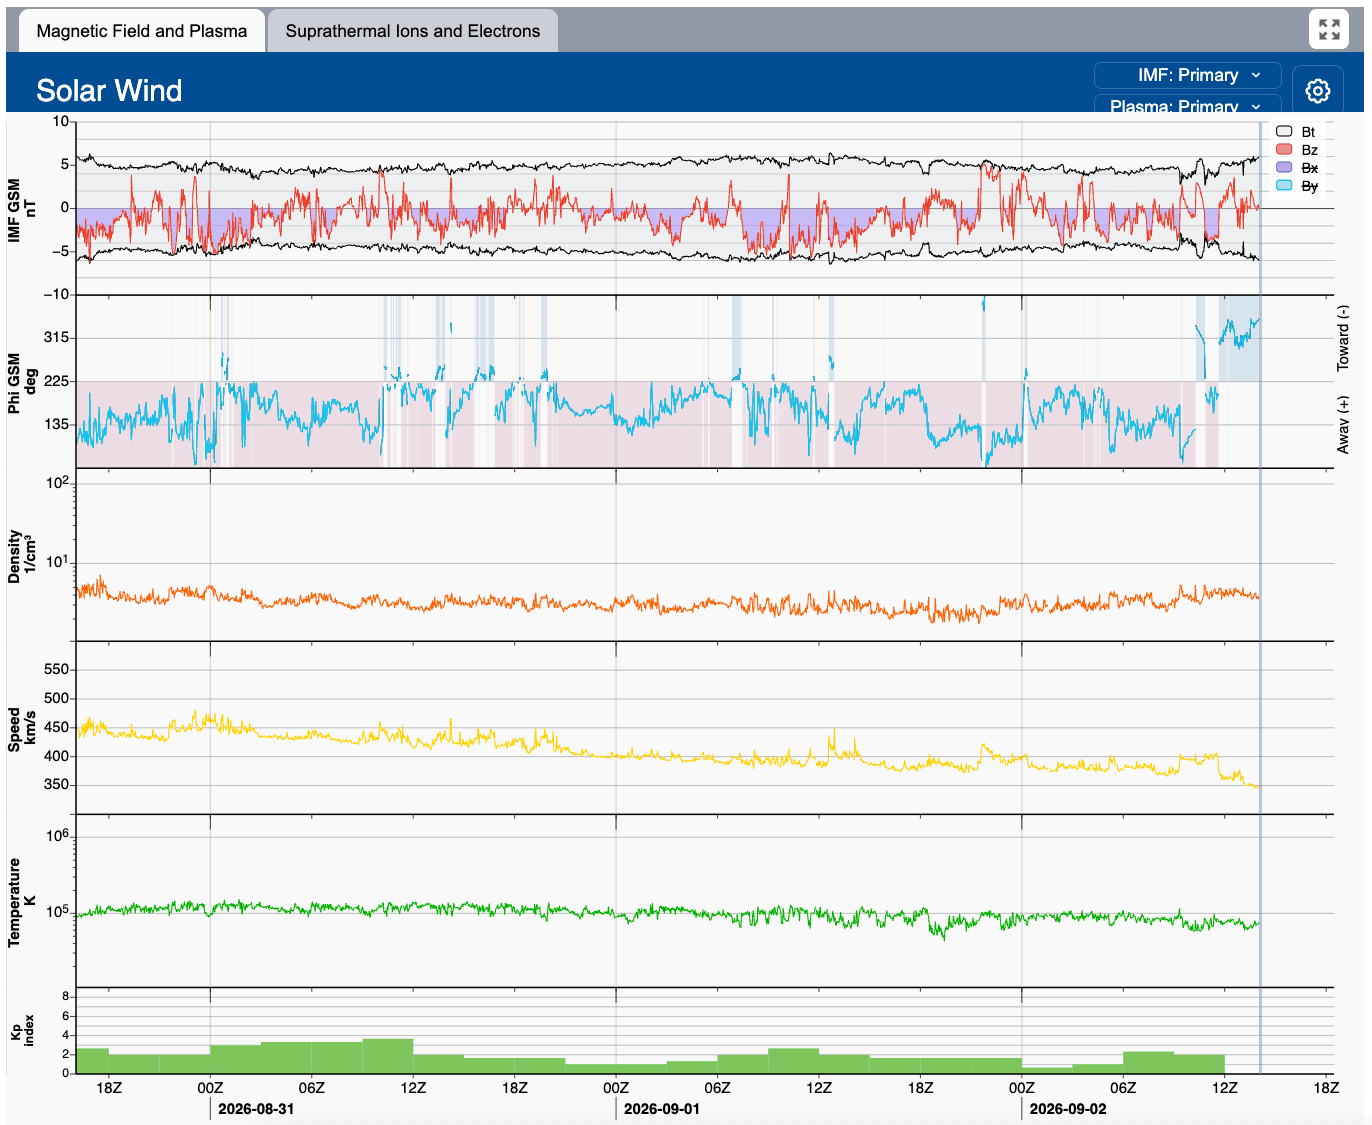
Because the solar wind takes time to cross the remaining distance, that gives us a warning window. Depending on wind speed, it’s usually somewhere between thirty and sixty minutes. When we watch Bz drop sharply on the DSCOVR feed, we know something is coming before it arrives.
Thirty to sixty minutes doesn’t sound like much. But it’s the difference between being parked in the right place with the cameras ready, and being on a bus heading back to town.
It’s also why a decision made at noon is worthless. The data that matters doesn’t exist yet at noon.
What This Looks Like on an Actual Day
We spend four to five hours a day on this, every day of the season. Not glancing at an app — actually working through it.
We watch the DSCOVR feed for solar wind speed, density and Bz. We follow coronal hole positions and how they’re rotating into an Earth-facing position, because those give a few days’ notice of elevated activity. We track solar flares and any coronal mass ejections, and where they’re likely to arrive.
Then we do the whole thing again in the evening, because most of it will have changed.
Cloud cover is the other half of the decision, and it’s a separate problem with its own traps — we’ve written about that in more detail here. The short version is that the solar data tells you whether the aurora will be there, and the cloud data tells you whether you’ll be able to see it. You need both, and either one can rule out a night on its own.
What this adds up to is that we often make the call late. Sometimes uncomfortably late. A night that looked poor at 4 PM can turn out fine, and a night that looked promising all week can fall apart by evening. Deciding early is more convenient for everyone — it’s just less accurate.
Why We Do It This Way
Across our seasons, guests who come out with us see the northern lights on about 93% of the nights we run.
That number isn’t luck, and it isn’t because we know a secret location. It’s because we don’t run tours on nights the data says won’t work, and because when the data says something is coming at half past midnight, we’re still out there at half past midnight.
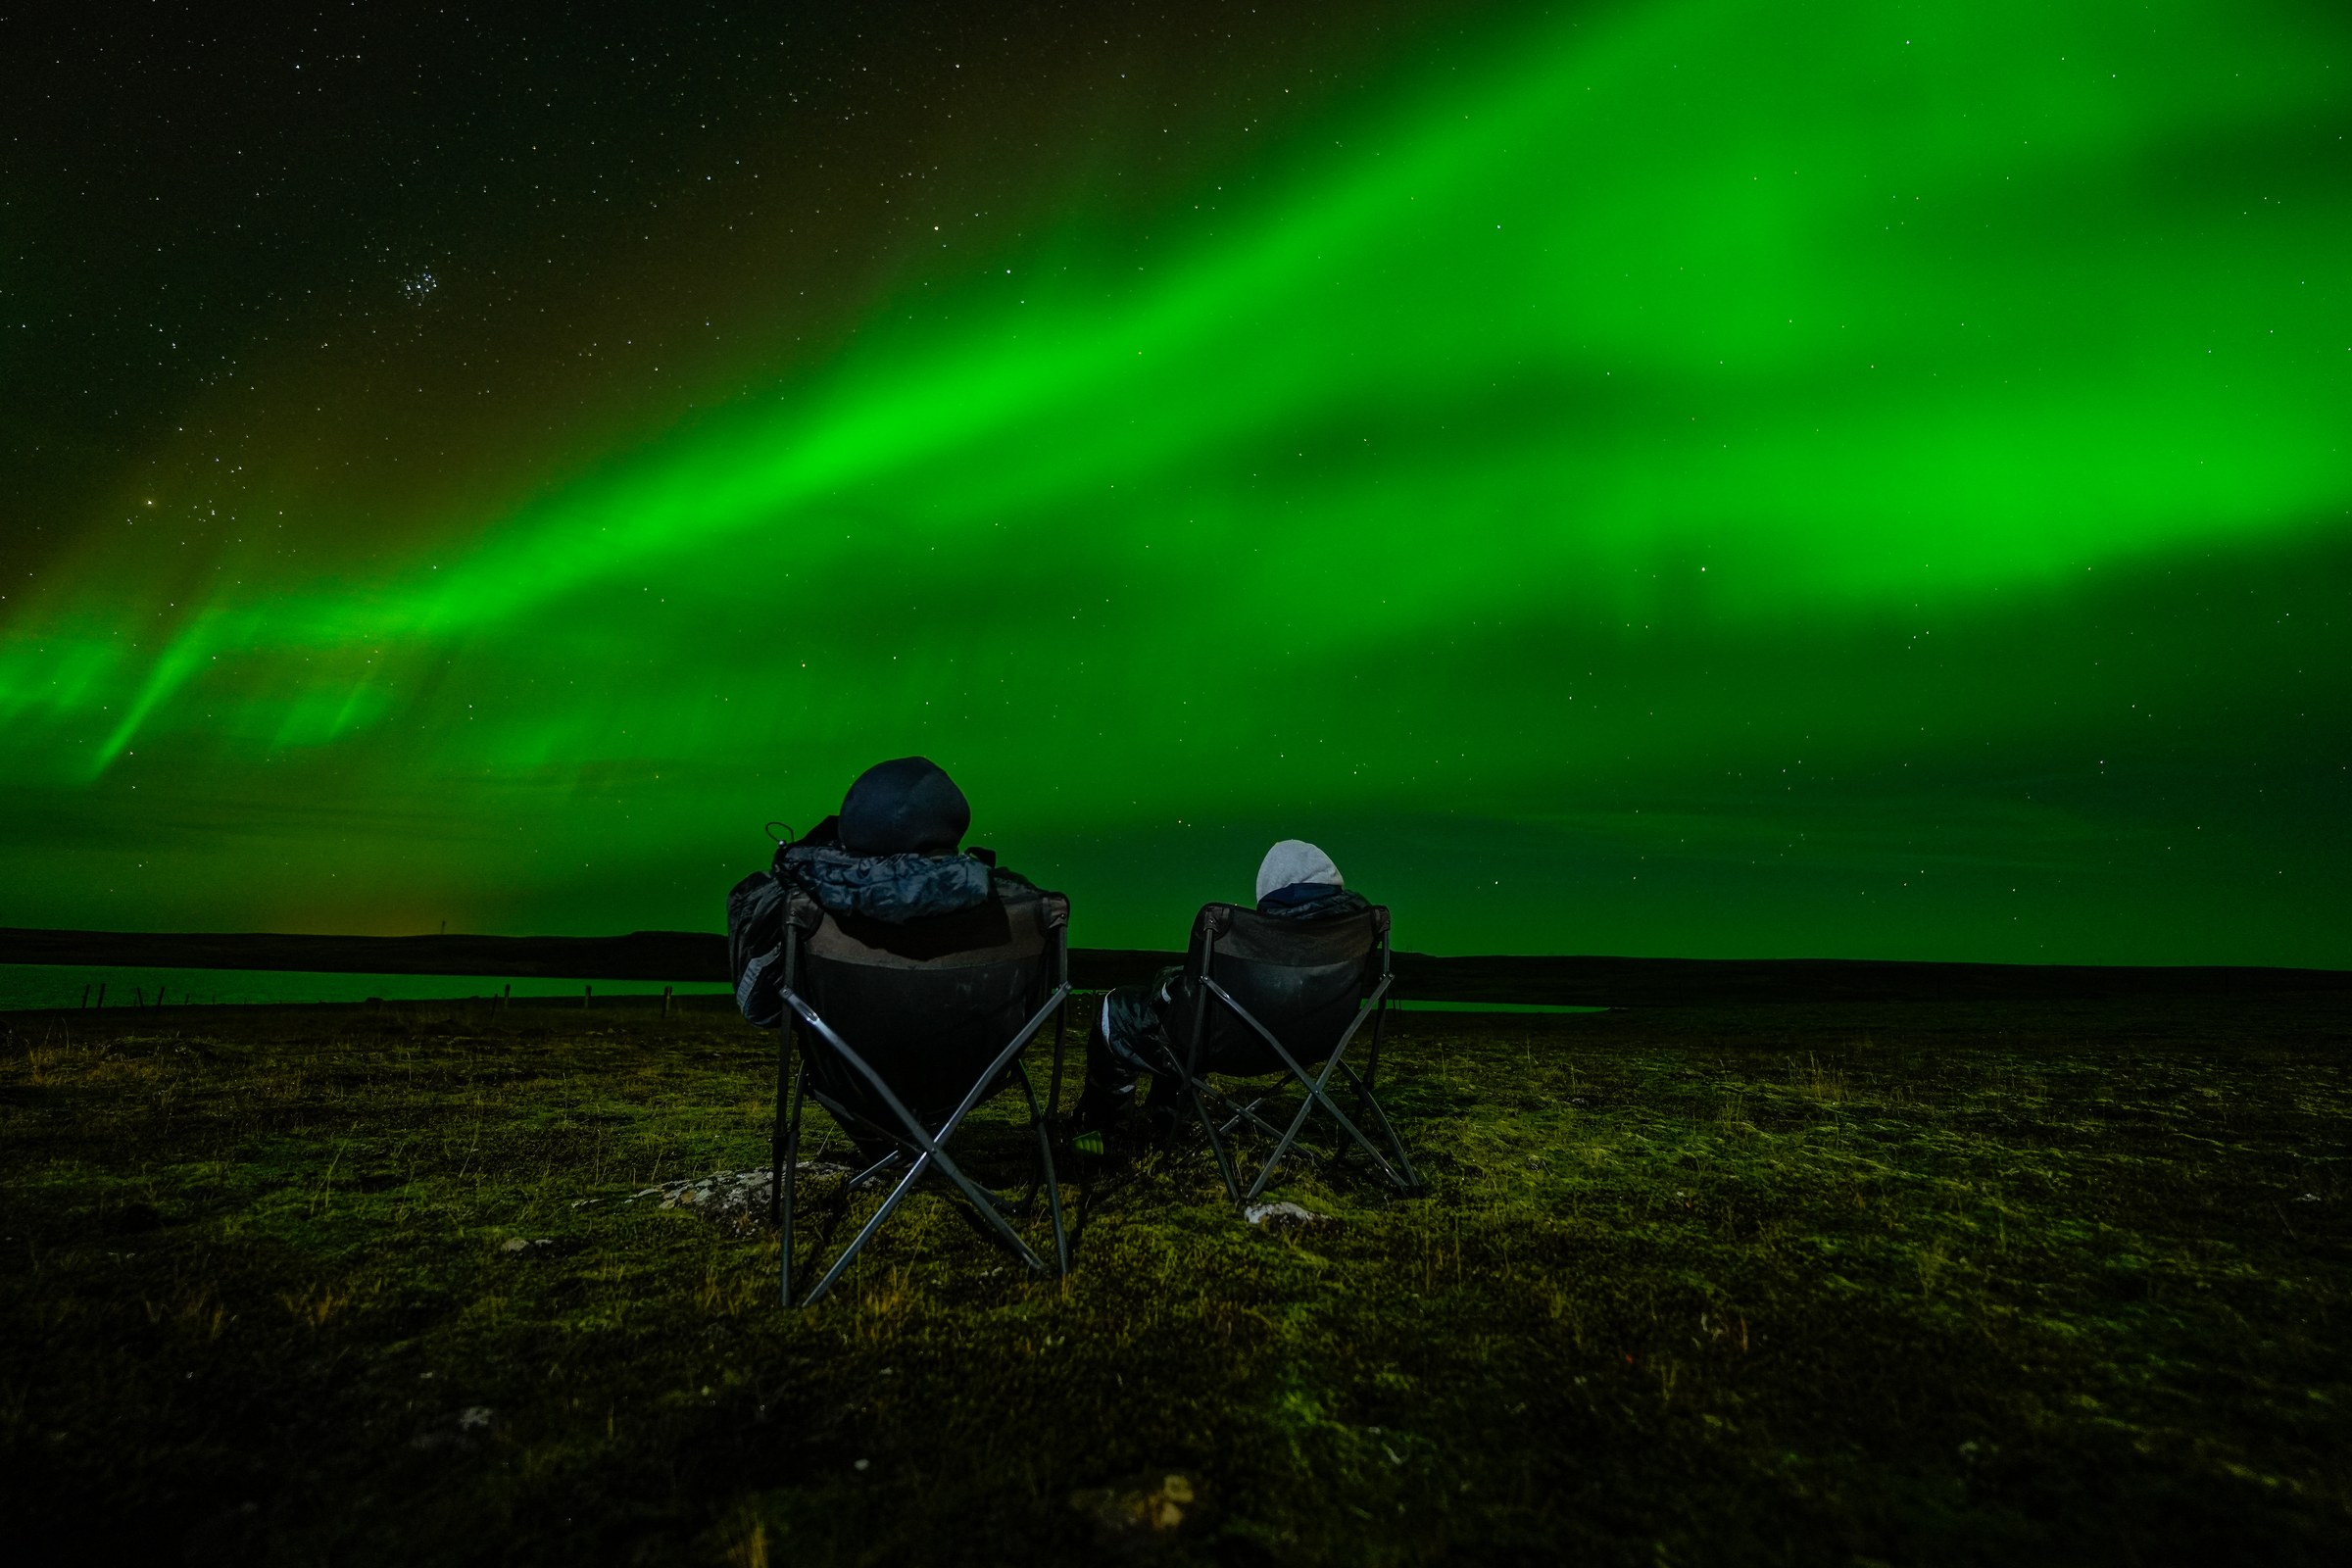
You don’t need to learn any of this to see the aurora in Iceland. That’s the point of going out with someone who already has — the reading, the watching and the waiting are the job, and they’re what separates a night that works from a night spent standing in the dark.
So it’s worth knowing that the number on your phone isn’t the one that decides your night. And it’s worth asking whoever you book with which numbers they’re actually watching.
/ GUIDES & INSPIRATION

